Search logs, jump to the trace

Logs arrive structured and linked to their trace. Any result opens the request that wrote it.

The surface

Filter by severity, service and attribute

Filter counts are computed for the time range you picked.
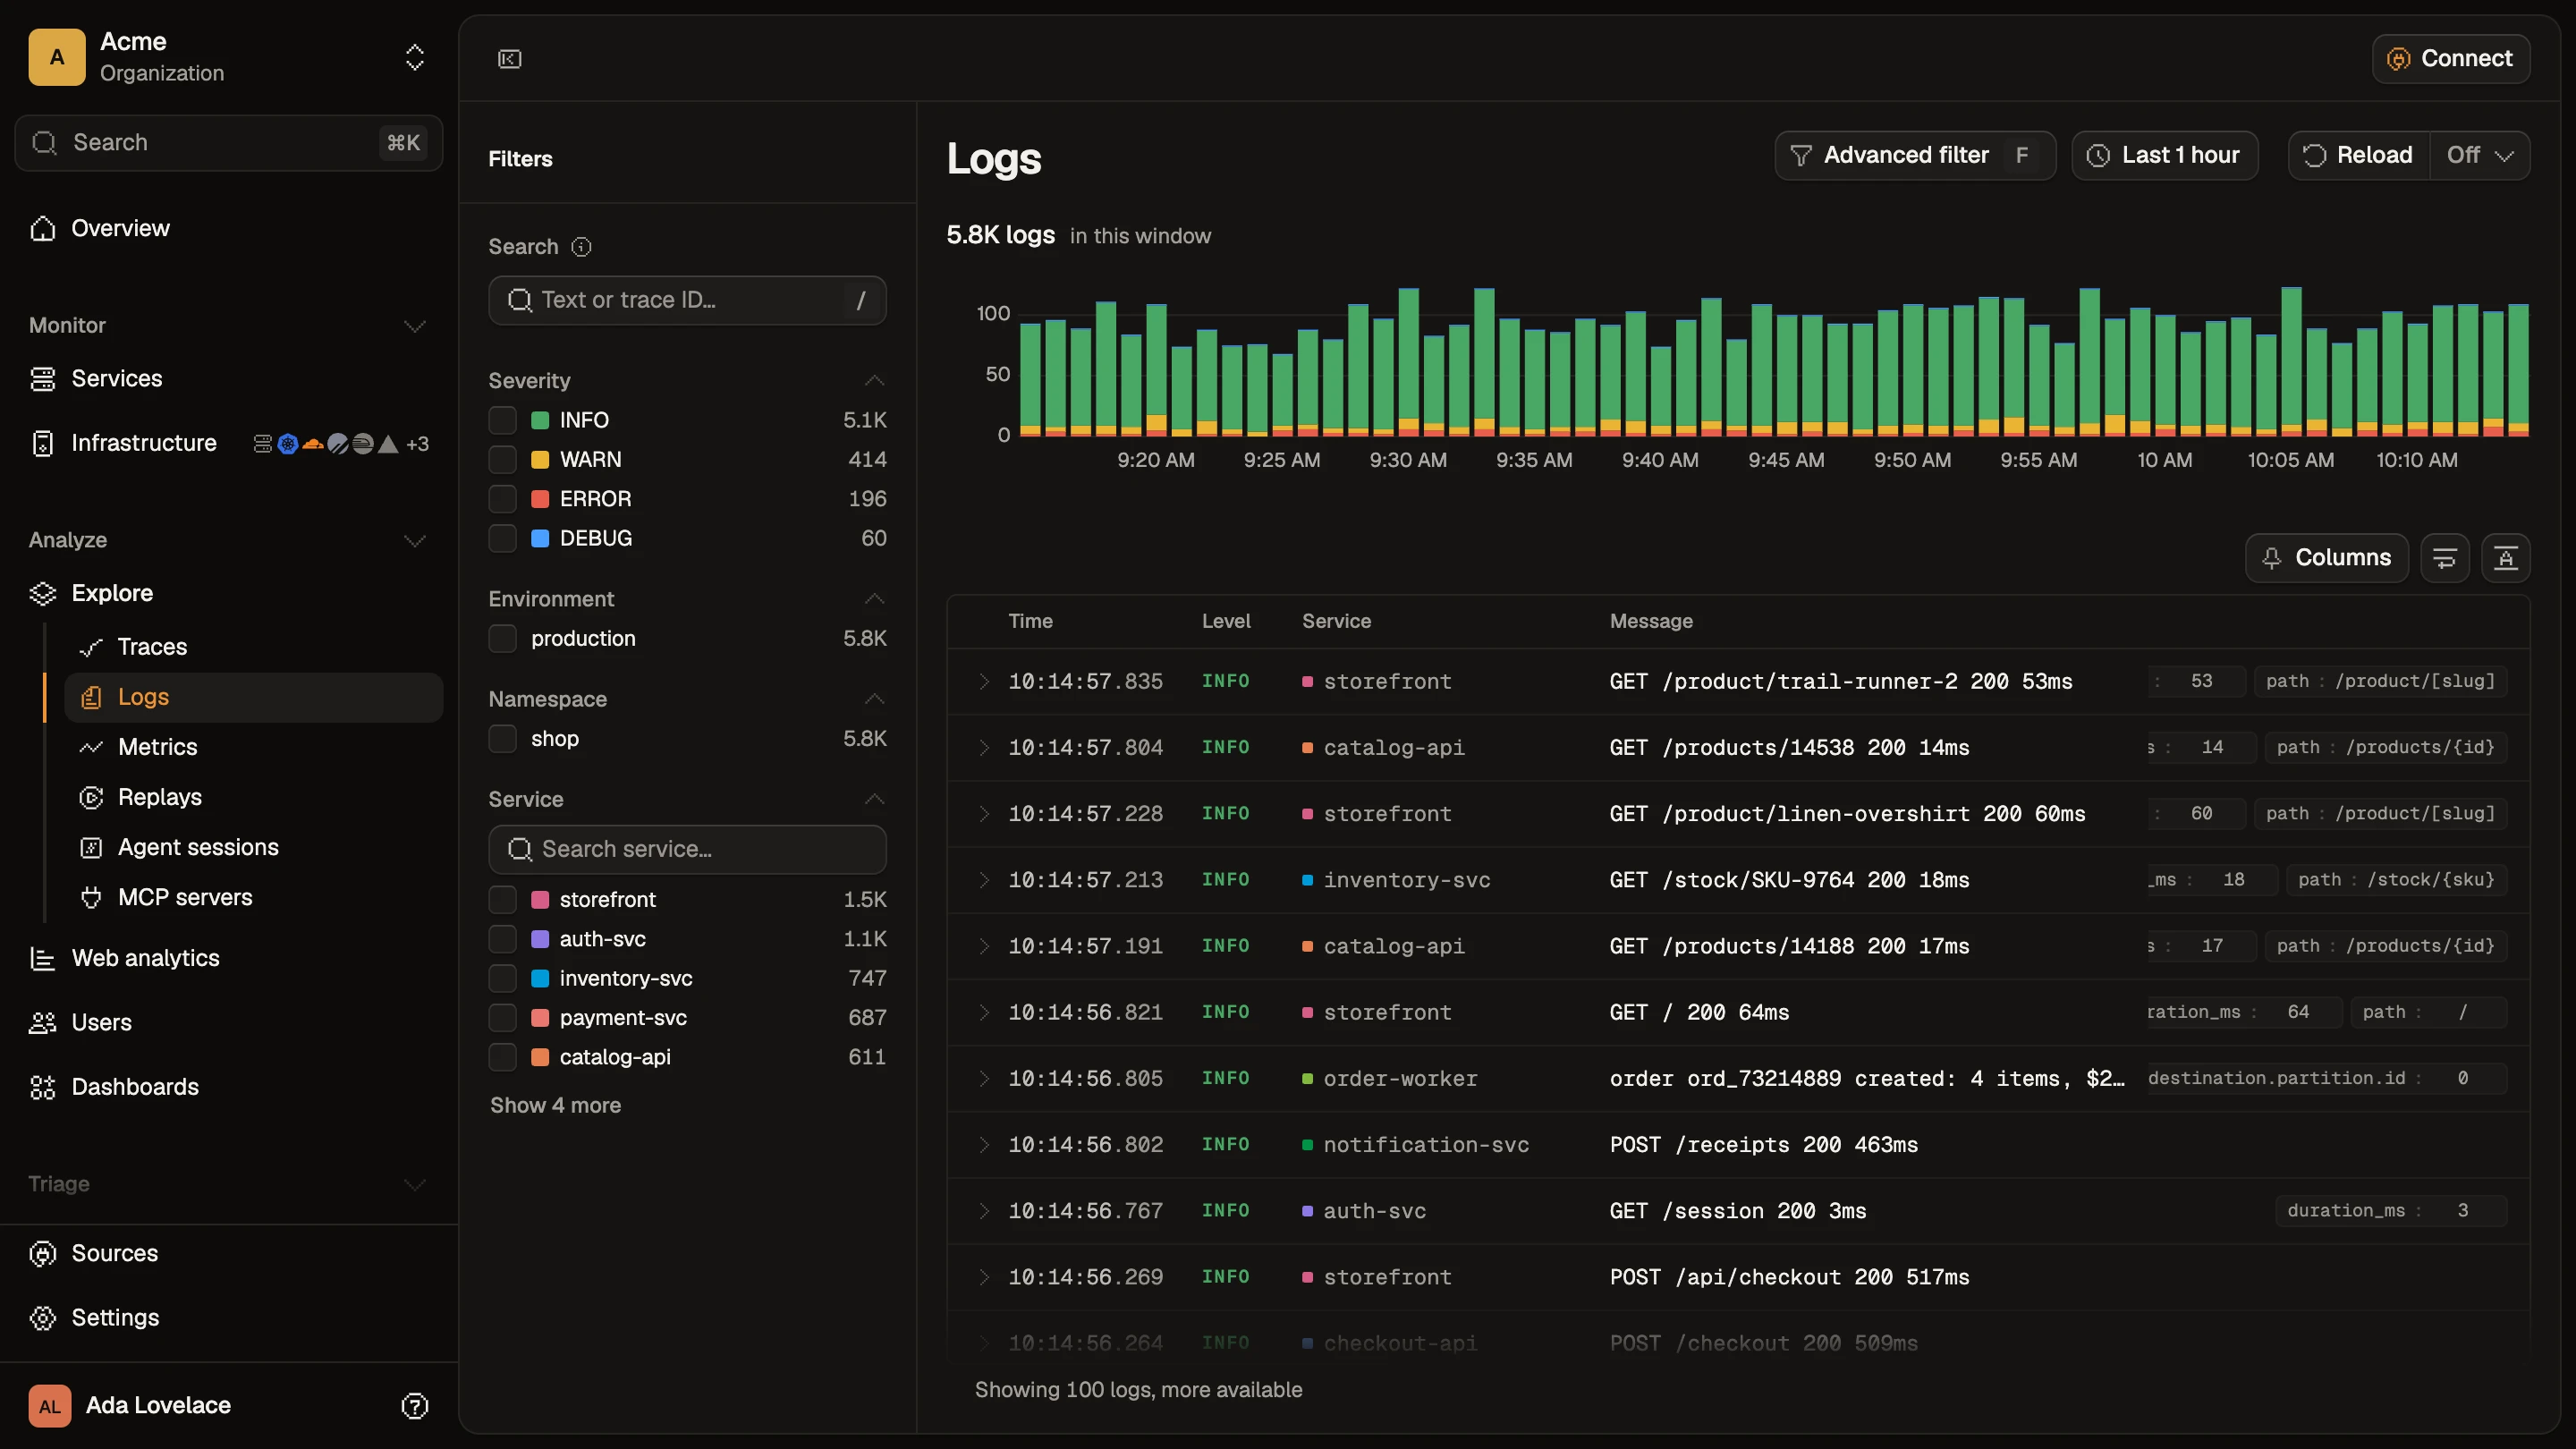
Structured log search with severity facets and attribute filters down the left rail
/logs severity >= WARN
signal
logs
transport
OTLP · no agent
severity
TRACE · DEBUG · INFO · WARN · ERROR · FATAL
filters
body · resource.* · log.*
joins.on
trace_id · span_id
buckets
5 min

In motion

Live tail

New lines stream in, tagged with service and severity. Same data as search.

logs · volume · last 5hLIVE
14.0K logsin selected range
4 severities · 60 buckets · 5m eachwarn cluster 11:10–11:40 · error blip 11:50
TimeLevelMessage
INFOPOST /api/checkout 402
INFOorder canceled order_id=ord_8421 reason=payment_declined
WARNfalling back to authorize-only flow
ERRORcard declined: insufficient_funds
INFOcharging card amount=129.00 currency=EUR
DEBUGevaluate flag fast_checkout=false cohort=A2
INFOreserved 3 items sku=SKU-9081,SKU-1142,SKU-0077
WARNstock low sku=SKU-9081 qty=3
INFOtoken verified user=u_4109 scope=checkout
DEBUGjwks cache hit kid=2026-05
INFOPOST /api/checkout received
INFOGET /api/cart 200
INFOloaded cart user=u_4109 items=3
INFOGET /api/inventory 200
DEBUGreschedule retry_at=12:04:25 job=sync-inventory
INFOPOST /api/feedback 201
16 logs

More screens

Log Management, screen by screen

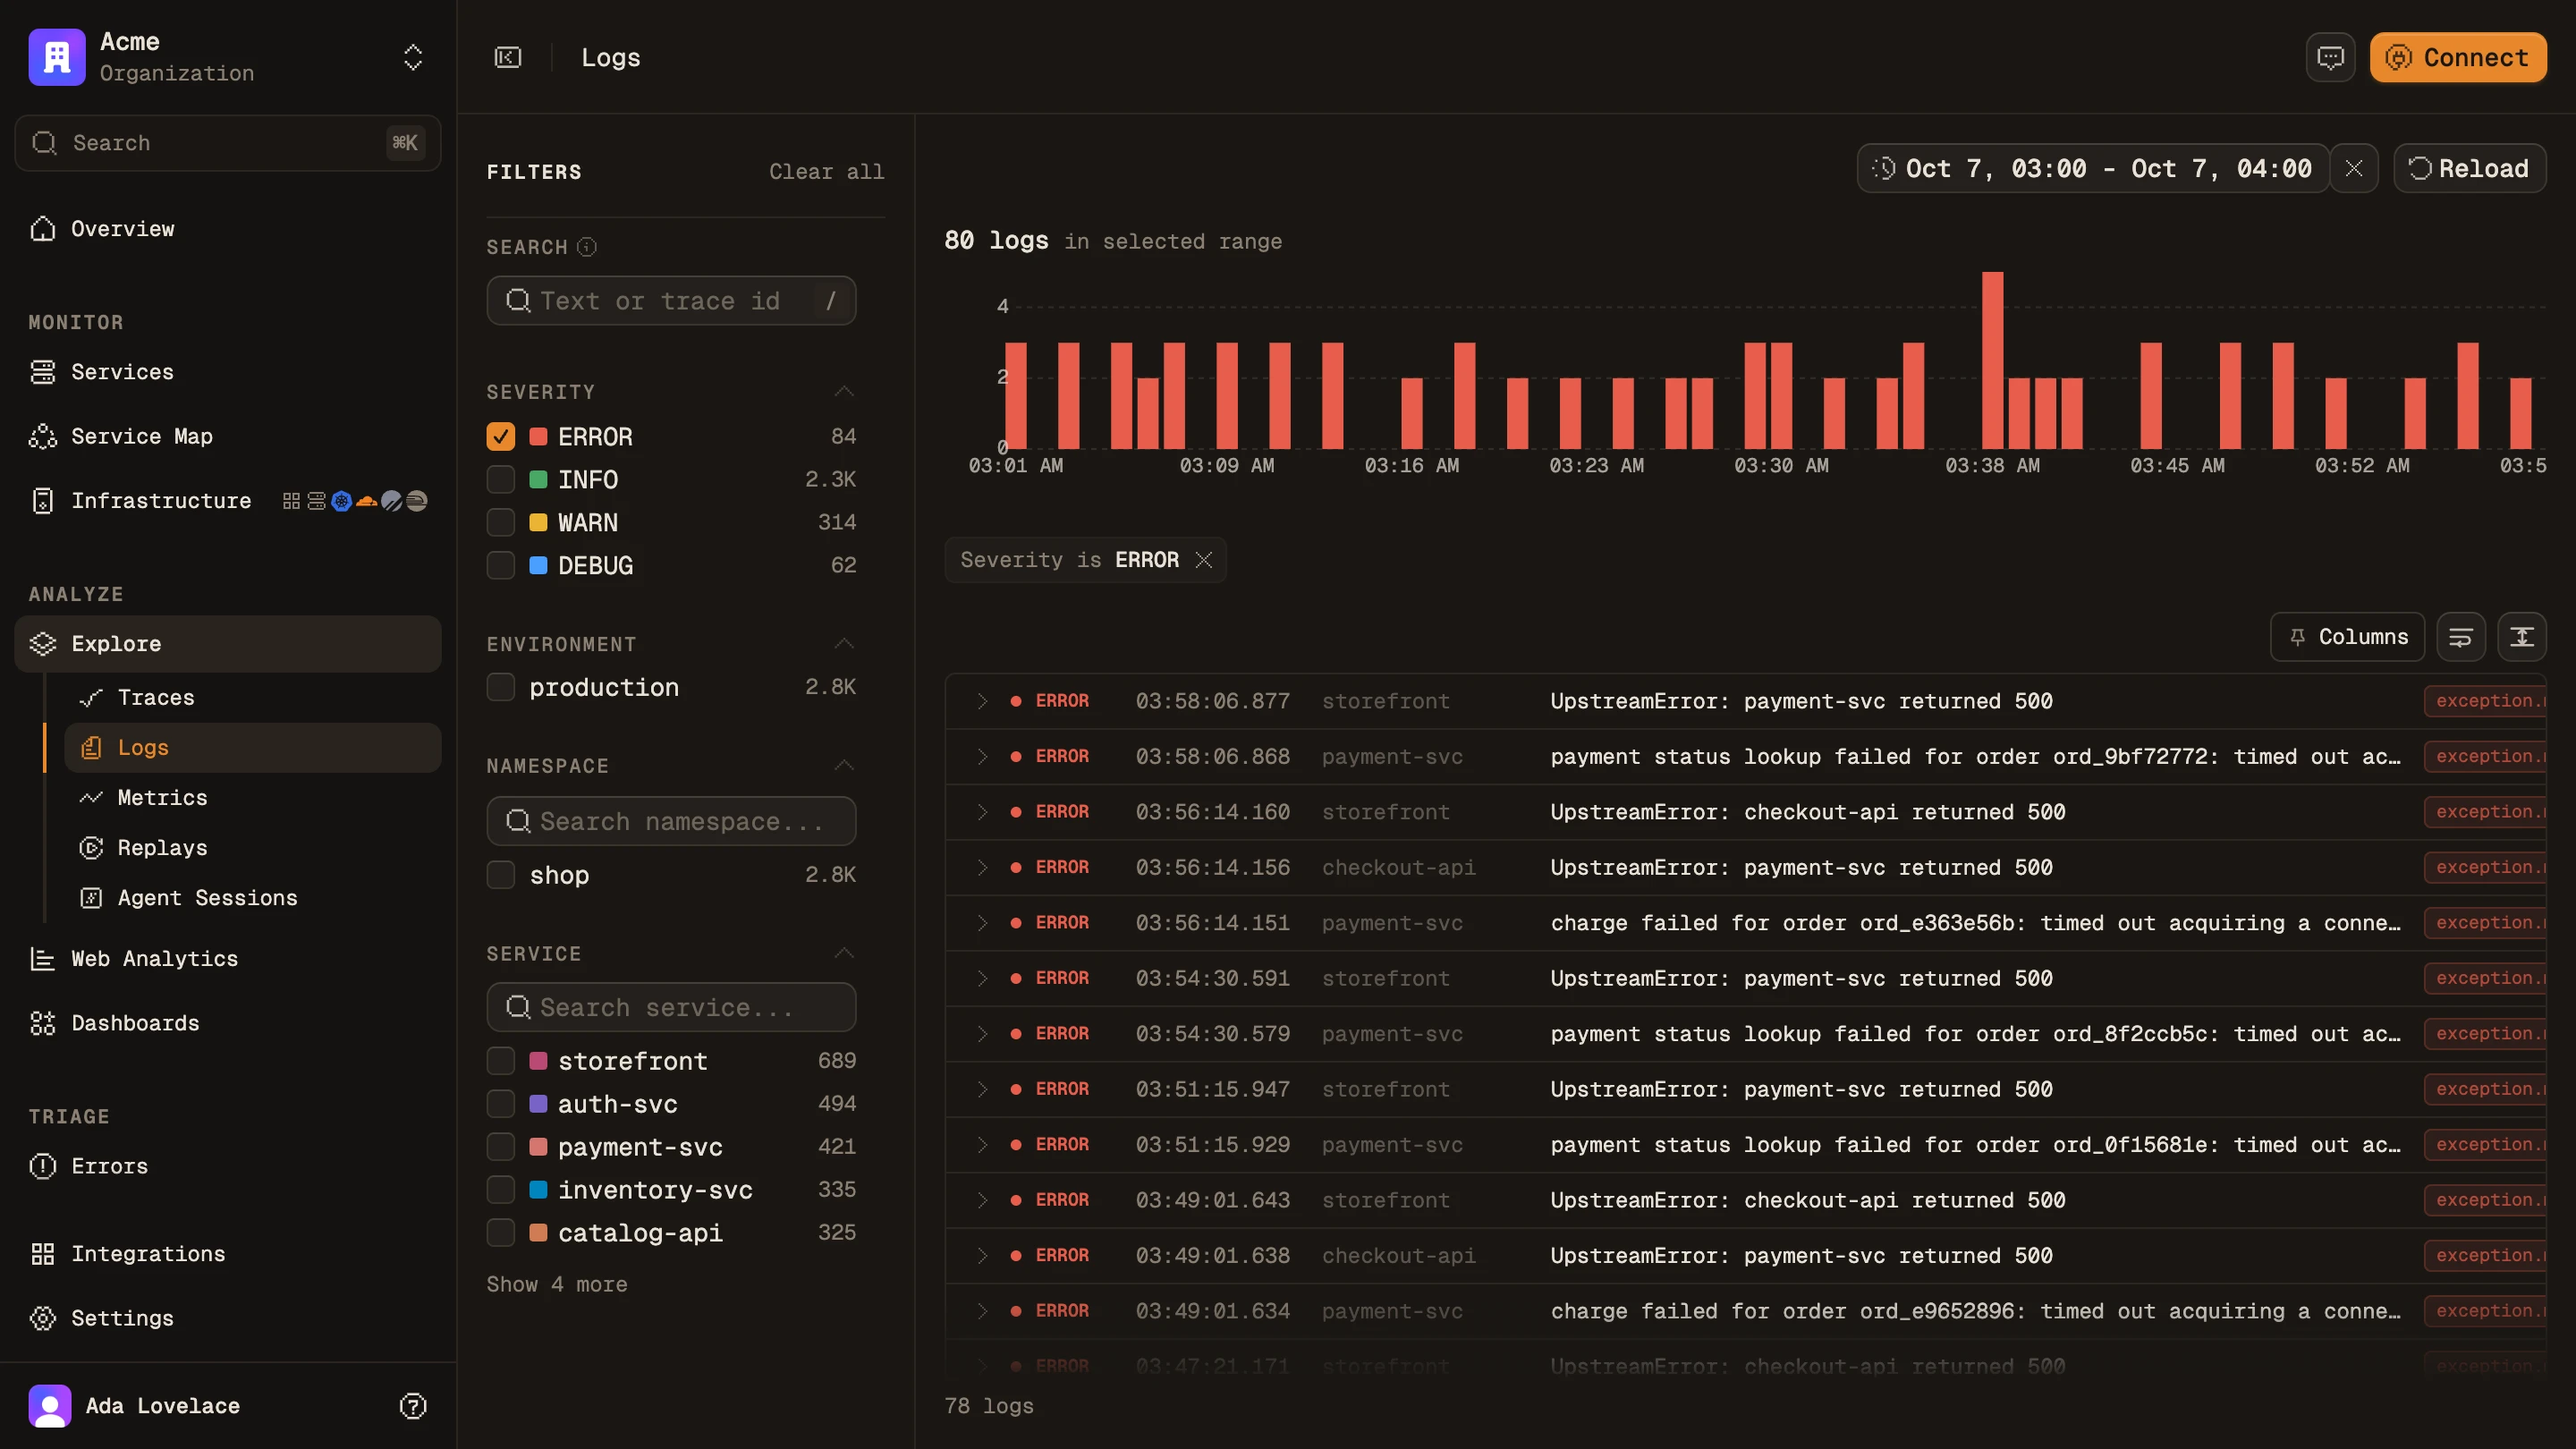
/logs ERROR across every service
Log search filtered to ERROR, with the volume chart and the lines that explain each failure
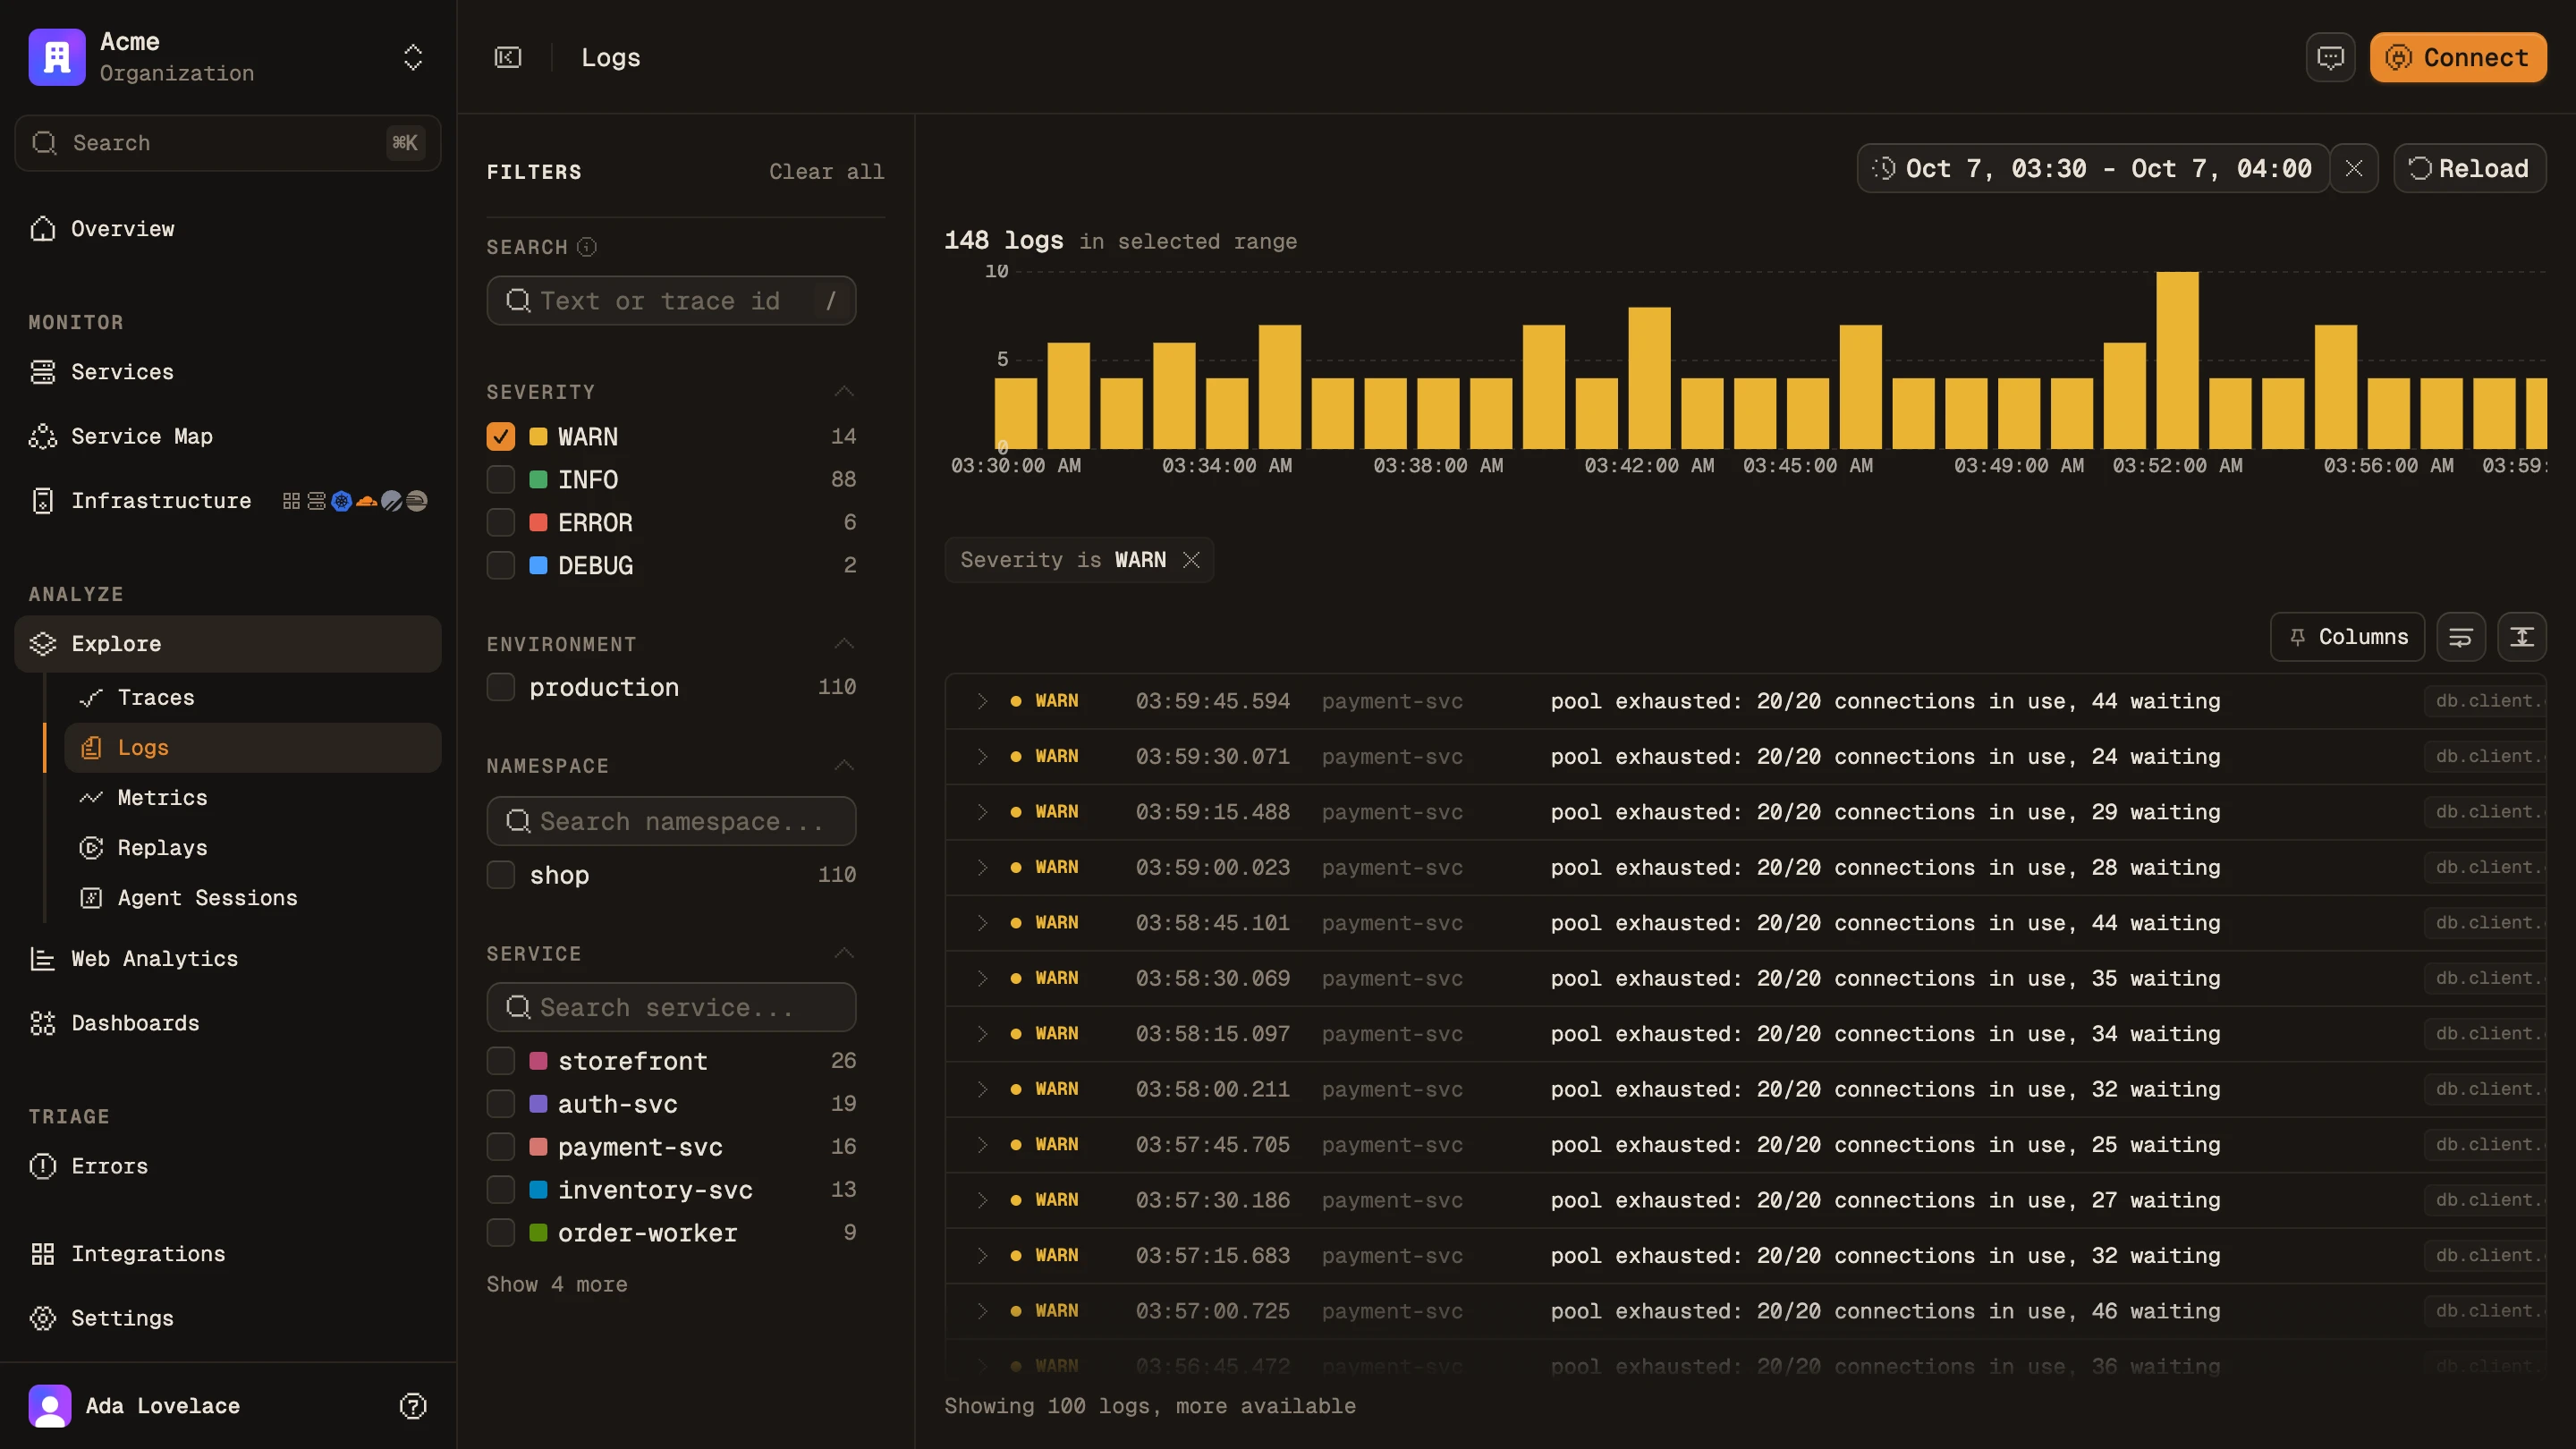
/logs Warnings before the failures
WARN lines: payment-svc reporting 20 of 20 pool connections in use, and slow requests upstream

What it does

What you can do with a log line

/logs?q=
Search text and attributes
Filter on service.name, environment or your own attribute keys, the same way you search message text.
severity
Severity at a glance
Each severity level has its own color and filter. WARN and ERROR are one click apart.
trace_id
Open the trace
Jump from any log line to the span that was running when it was written.
volume histogram
Spot spikes first
A chart above the results, colored by severity, shows an error burst before you read a line.
OTLP
Standard OpenTelemetry
Logs come in over OTLP with your traces and metrics. No extra agent or pipeline.

On the plan

Price, retention and setup

plan
Startup, $39/month, with a 14-day free trial. Every feature is on.
billed as
Logs: 100 GB included, then $0.30 / GB
retention
Log lines 30 days. Hourly log aggregates, 365 days.

In production: Superwall sends Maple more than 80 billion traces, logs and metrics a month, about 18 TB, with nothing sampled out. Read the Superwall story

Keep going

Related features

Point OTLP at Maple.

One endpoint, one key. Traces, logs, metrics and sessions, linked from the first request.